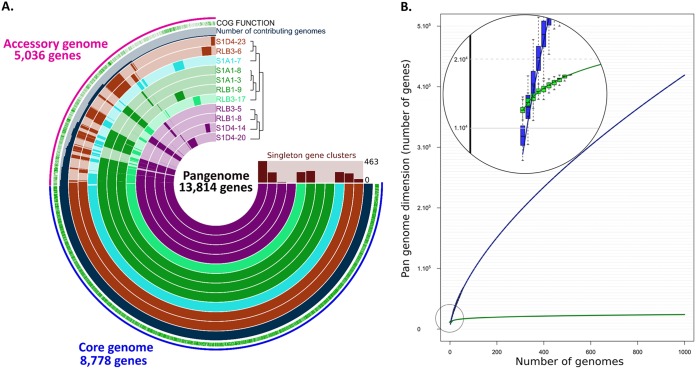
FIG 1.
Pangenome analysis of the Streptomyces population. (A) Comparative Anvi’o genomic analysis of the 11 conspecific strains isolated in this study. The inner layers represent individual genomes organized regarding their phylogenetic relationships as indicated by the dendrogram. In the layers, dark colors indicate the presence of a gene group and light color its absence. The core (8,778 genes) and the accessory (5,036 genes) genomes are indicated in blue and pink, respectively, in the outmost layer. The blue layer represents the number of genomes among the population contributing to each gene group, and the green layer describes the gene groups in which at least one gene was functionally annotated using cluster of orthologous genes (COGs). (B) Comparison of the Streptomyces pangenome evolution at the genus and the population levels. The evolution of the pangenome of 59 complete Streptomyces genomes at the genus level is represented in blue. Its extrapolation to 1,000 genomes did not show any shift in the trend of the curve, indicating an open pangenome. The evolution of the population pangenome is represented in green. Its extrapolation rapidly reaches a plateau (see zoomed section).

