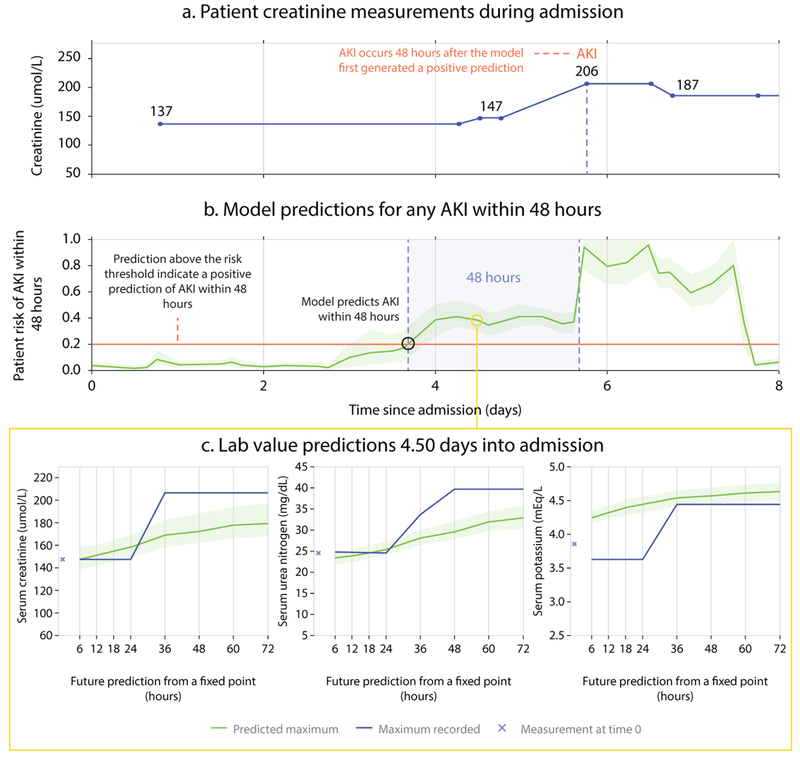
Figure 1 |. Illustrative example of risk prediction, uncertainty and predicted future laboratory values.
The first 8 days of admission for a male patient aged 65 with a history of chronic obstructive pulmonary disease. (a) Creatinine measurements showing AKI occurring on day 5. (b) Continuous risk predictions; the model predicted increased AKI risk 48 hours before it was observed. A risk above 0.2, corresponding to 33% precision, was the threshold above which AKI was predicted. Lighter green borders on the risk curve indicate uncertainty, taken as the range of 100 ensemble predictions once trimmed for highest and lowest 5 values. (c) Predictions of the maximum future observed values of creatinine, urea, and potassium.

