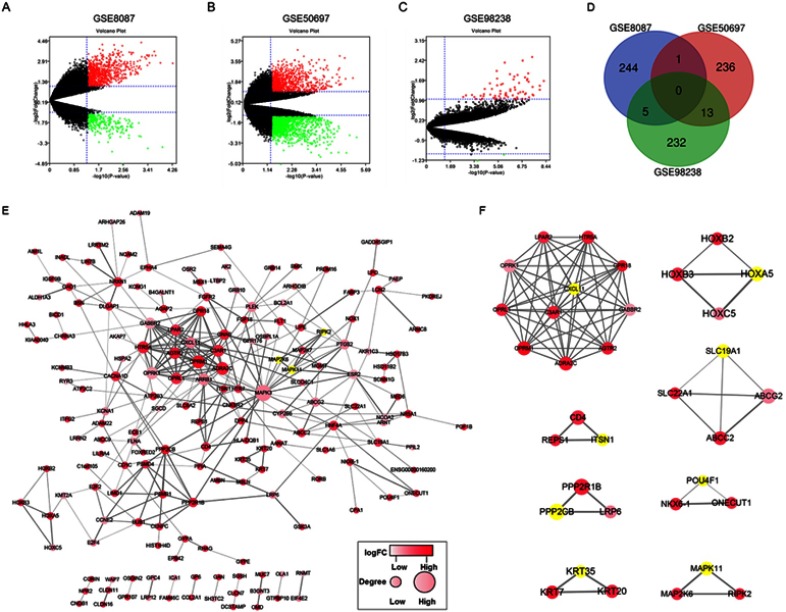
Figure 1.
Volcano plot, Venn diagram, PPI network, and the significant module of DEGs. (A–C) Volcano plot of the DE-mRNAs from GSE8087, GSE50697, and GSE98238 datasets, the red dots and green dots represent the upregulated and downregulated (logFC>1.5 or <-1.5). (D) The top of 250 DEGs were selected with a P-value <0.05 among the mRNA expression profiling sets GSE8087, GSE50697, and GSE98238. The 3 datasets showed an overlap of 0 gene. (E) The PPI network of DEGs from GSE8087 set was constructed using Cytoscape. (F) The significant module was obtained from PPI network. The color of a node in the PPI network reflects the log (FC) value of the Z score of gene expression, and the size of the node indicates the number of interacting proteins with the designated protein.

