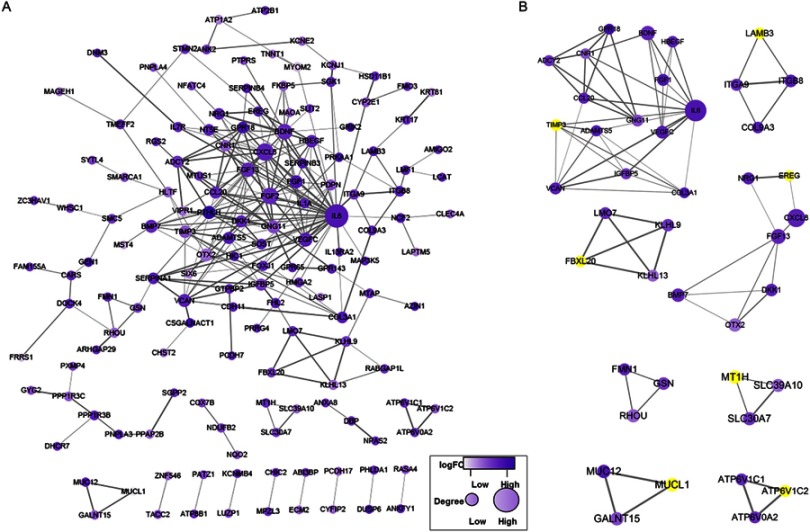
Figure 2.
PPI network and the significant module of DEGs from GSE50697 dataset. (A) The PPI network of DEGs from GSE50697 set was constructed using Cytoscape. (B) The significant module was obtained from PPI network. The color of a node in the PPI network reflects the log (FC) value of the Z score of gene expression, and the size of the node indicates the number of interacting proteins with the designated protein.

