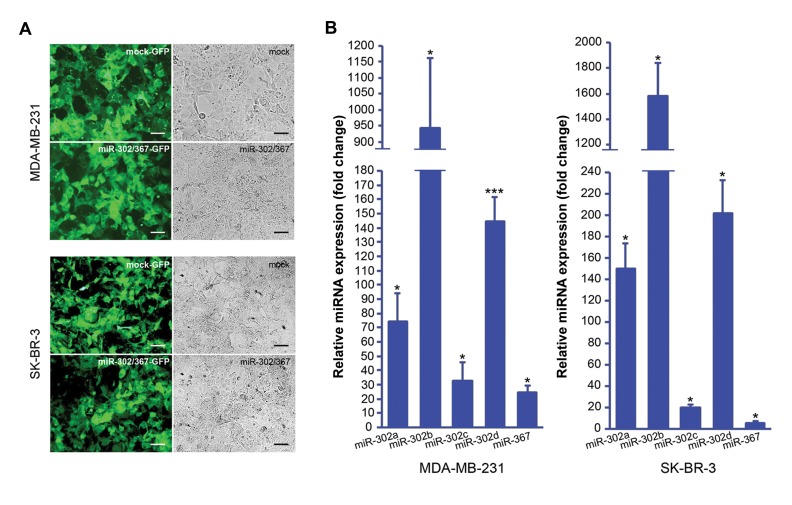
Fig.1.
Ectopic expression of miR-302 cluster in the BC cells. A. Photomicrographs of the MDA-MB-231 and SK-BR-3 cells transfected with either miR-302/367 or mock vector. Transfected cells show GFP expression. Scale bar represents 50 µm and B. Assessment of miR-302/367 expression using quantitative real-time polymerase chain reaction (qPCR) in MDA-MB-231 cells (left) and SK-BR-3 cells (right) transfected with miR-302/367 vector. Fold changes are reflected on the vertical axis compared to the control group (transfected with mock vector) which has been normalized to 1. Analysis performed by REST 2009 software based on a Pair Wise Fixed Reallocation Randomisation Test. and significant P values (*; P<0.05, ***; P<0.001) are indicated on the chart. BC; Breast cancer and GFP; Green fluorescent protein.

