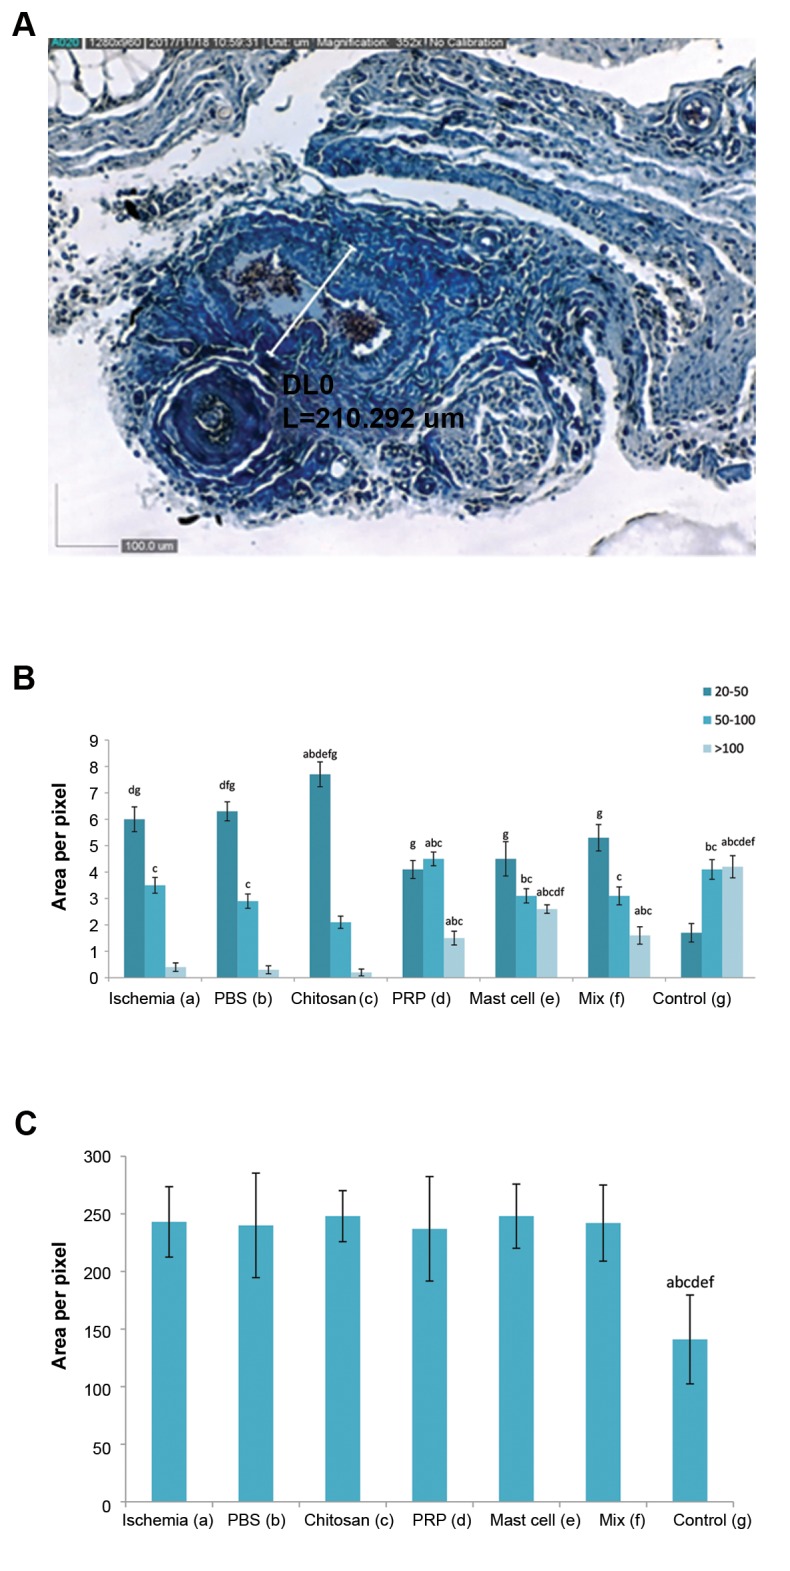
Fig.3.

Micrograph and histograms presented collagen distribution andvessel morphometry in the cell transplanted area. A. Representativemicrograph (×352 magnification) showing individual morphometricanalysis of blood vessels (collagen deposition is shown as blue color) stained with Masson’s trichrome staining method and evaluated with the Dino Capture 2.0 software, B. The bar graph shows vesselmorphometry in experimental groups in femoral artery transected area according to cross-sectional thickness (20-50, 50-100, and >100 µm), and C. Histogram showed a semi-quantitative comparison of connective tissue density (intensity and distribution) Ischemiainduced distribution of collagen fibers at the site of femoral artery resection was unaffected by any intervention. All values are expressed as the mean ± SEM, a-g represent statistically significant differences (P<0.05) among indicated groups. In this study, we used 5 animals in each group. PRP; Platelet-rich plasma, Mix; Chitosan, PRP, and mast cell group, and PBS; Phosphate-buffered saline.
