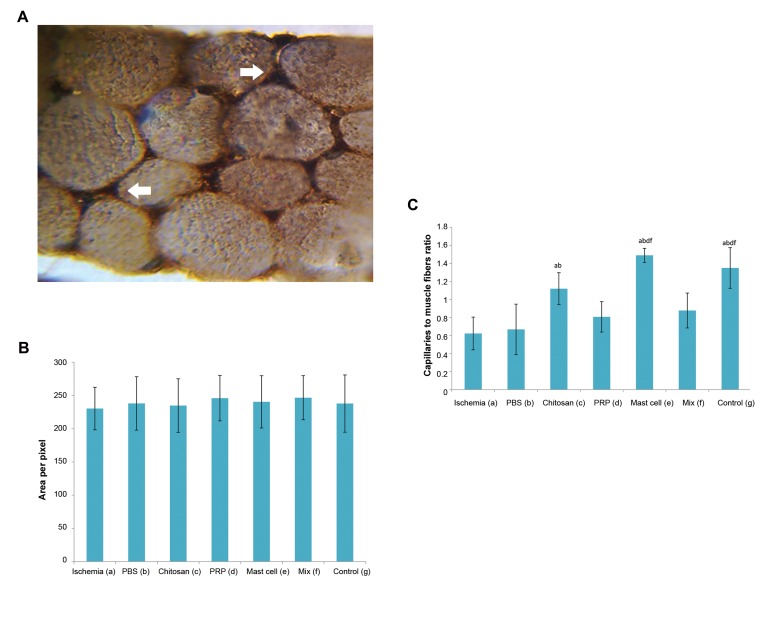
Fig.4.
Micrograph and histogram presented the blood vessels data’s and connective tissue density in the gastrocnemius muscles. A. Immunohistochemical staining for CD34-positive endothelial cells (dark brown, arrowed) between the gastrocnemius muscle fibers (×1500magnification), B. The graph indicates semi quantitative intensity of endomysium and perimysium (connective tissue) density in different groups, and C. The effect of ischemia and interventions on the capillary to gastrocnemius muscle fiber ratio. All values are expressed as the mean ± SEM, a-f represent statistically significant differences (P<0.05) among indicated groups. In this study, we used 5 animals in each group. PRP; Platelet-rich plasma, Mix; Chitosan, PRP, and mast cell group, and PBS; Phosphate-buffered saline.

