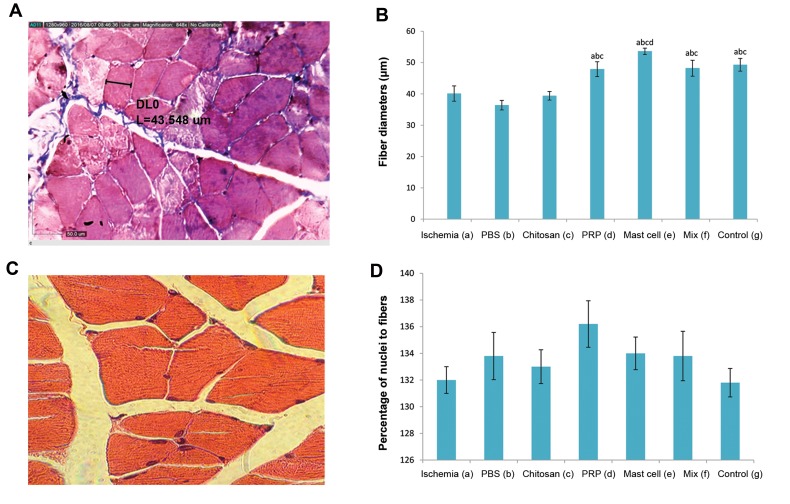
Fig.5.
Illustrations for histomorphometric analysis of gastrocnemius muscles. A. Representative morphometric analysis of gastrocnemius muscle fibers (×848 magnification) stained with Masson’s trichrome stain and determined using the Dino Capture 2.0 software, B. Histogram showed the effect of ischemia and various interventions on fiber diameter, C. Representative H&E stained a transverse section of muscle demonstrating the calculation of the ratio of the nuclei to the number of muscle fibers (×1000 magnification), and D. Histogram showed the percentage of nuclei to muscle fibers. All values are expressed as the mean ± SEM, a-d represent statistically significant differences (P<0.05) among indicated groups. In this study, we used 5 animals in each group. PRP; Platelet-rich plasma, Mix; Chitosan, PRP, and mast cell group, PBS; Phosphate-buffered saline, and H&E; Hematoxylin and eosin.

