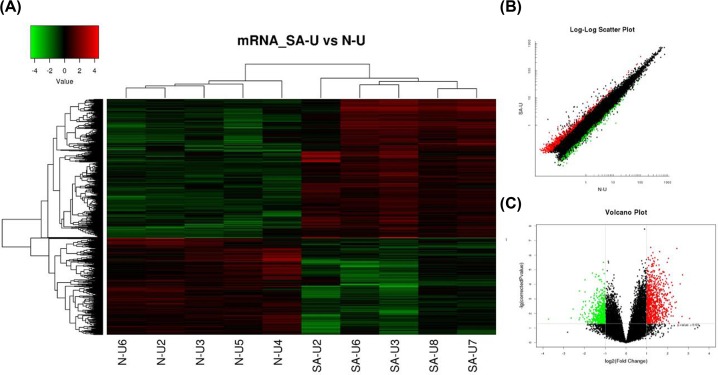
Figure 4. Differential expression of mRNAs in SAP patients and control individuals of Uyghur ethnicity.
(A) Expression values are represented through hierarchical clustering analysis in red and green, indicating up- and down-regulated mRNA expressions in SAP patients (SAP-U2, SAP-U3, SAP-U6, SAP-U7, SAP-U8) or control individuals (N-U2, N-U3, N-U4, N-U5, N-U6), respectively. (B) Scatter plot of differential mRNA expression. x-axis: N-U, y-axis: SAP-U. (C) Volcano plot of differential mRNA expression. The red and green spots indicate up- and down-regulation, respectively. x-axis: log2 Fc; y-axis: −1 × log10 (corrected P-value) for each probe.

