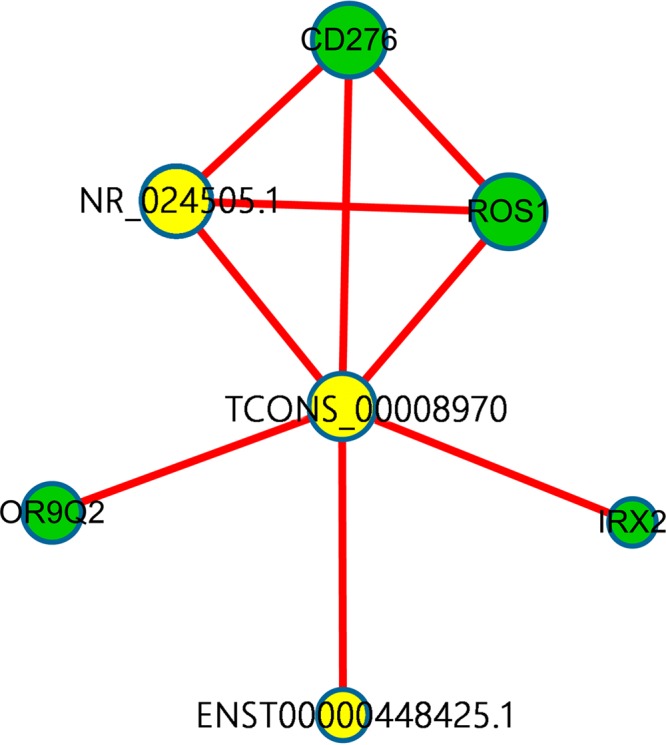
Figure 7. LncRNA–mRNA network was constructed to present the correlation analysis between the differentially expressed lncRNAs and mRNAs.

Yellow node represents the lncRNAs and green node represents the target mRNAs. The red outgoing link represents up-regulation, the size of each circle represents the significance of the correlation.
