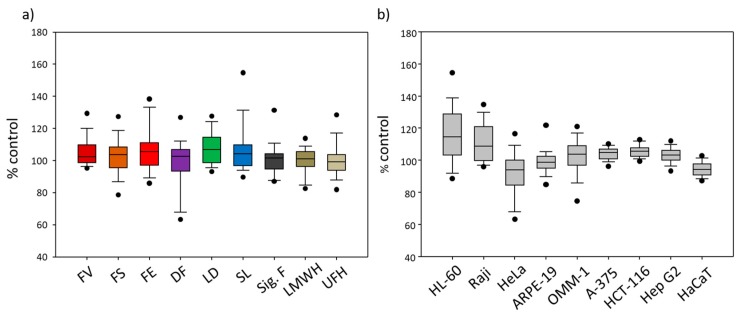
Figure 3.
(a) Cell viability changes (all nine tested cell lines combined) in response to differently sourced fucoidans (i.e., from Fucus vesiculosus (FV), Fucus serratus (FS), Fucus distichus subsp. evanescens (FE), Dictyosiphon foeniculaceus (DF), Laminaria digitata (LD) and Saccharina latissima (SL)) as well as to the reference substances Sigma-Aldrich fucoidan (F. vesiculosus) (Sig. F), enoxaparin (LMWH) and heparin (UFH). (b) Cell viability changes (all nine test compounds combined, i.e., seven fucoidans, LMWH and UFH) depending on the cell line. The Whisker box plots are based on all the measured effects of each test compound (i.e., 1–100 µg/mL). The boxes represent the 25th percentile (boundary of the box closest to zero), the median (horizontal line in the box) and the 75th percentile (boundary of the box farthest from zero). Whiskers (error bars) above and below the box indicate the 95th and 5th percentiles. Outliers are shown as individual points.

