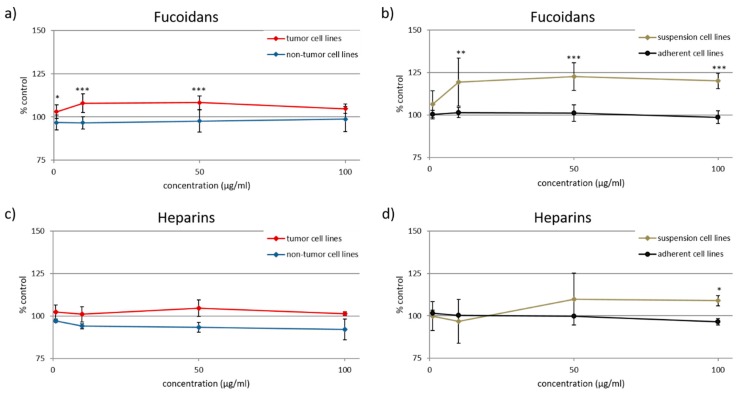
Figure 4.
Cell viability effects of tested a), b) fucoidans and c), d) heparins in dependence on the type of cell line (Table 2). a) and c) show the mean cell viability of tumor and non-tumor cell lines and b) and d) that of suspension and adherent cell lines. Values are expressed as mean and standard deviation in relation to untreated control (100%). (n ≥ 4 × 3) Significances between tumor vs. non-tumor and suspension vs. adherent cell lines, respectively, were determined using student’s t-test * p < 0.05, ** p < 0.01, *** p < 0.001.

