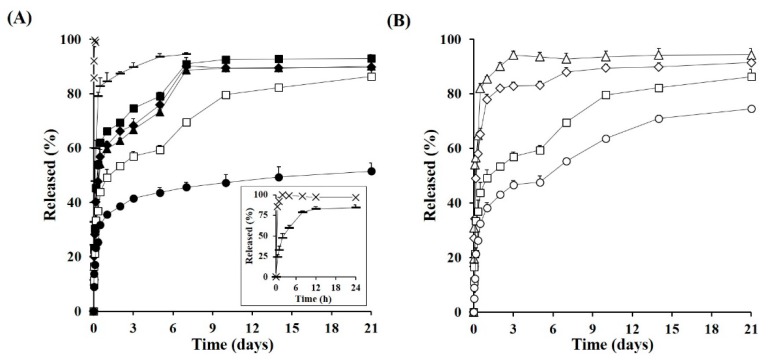
Figure 3.
In Vitro release profile of TA from the novel MSs under accelerated conditions (45 °C). (A) Drug release profile from the marketed product (×), 7.2 μm-sized TA crystals-loaded MS (F0, –), and 1.7 μm-sized TA crystals-loaded MS prepared with different PLGA:PLA ratios; 4:0 (F1, ■), 3:1 (F2, ♦), 2:2 (F3, ▲), 1:3 (F4, □), and 0:4 (F5, ●) and (B) drug release profile from MSs prepared with different drug:polymer ratios; 1:2 (F6, △), 1:3 (F7, ◇), 1:5 (F4, □), and 1:10 (F8, ○); Notes: The inset graph (A) is the magnified release profile from the marketed product and 7.2 μm-sized TA crystals-loaded MS. Data are expressed as the mean value (n = 3) and error bars are SDs.

