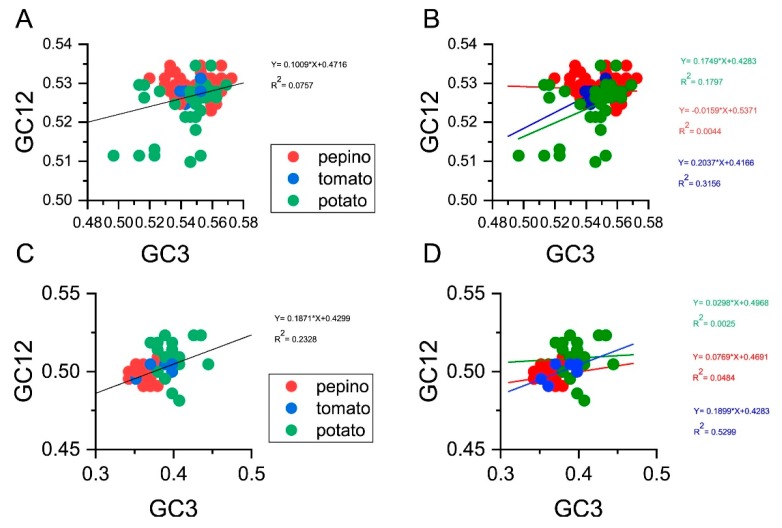
Figure 5.
Neutrality plot analysis of GC3s against GC12s for all the coding sequences (A) and different hosts (B) based on the CP gene, and that for the coding sequences (C) and different hosts (D) based on the NABP genes, respectively. The pepino, potato and tomato hosts are represented in red, green and blue dots, respectively.

