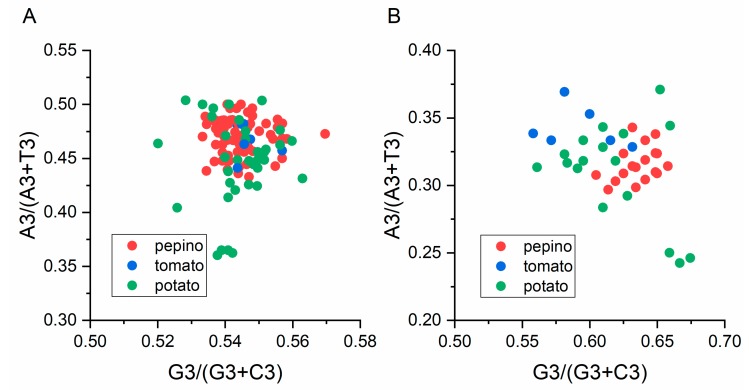
Figure 6.
The AT [A3%/(A3% + T3%)] and GC [G3%/(G3% + C3%)] bias of the CP (A) and NABP (B) genes of PVM are shown. The center of the plot (both the coordinates is 0.5), indicating a position where there is no bias. The pepino, potato and tomato hosts are represented by red, green and blue dots, respectively.

