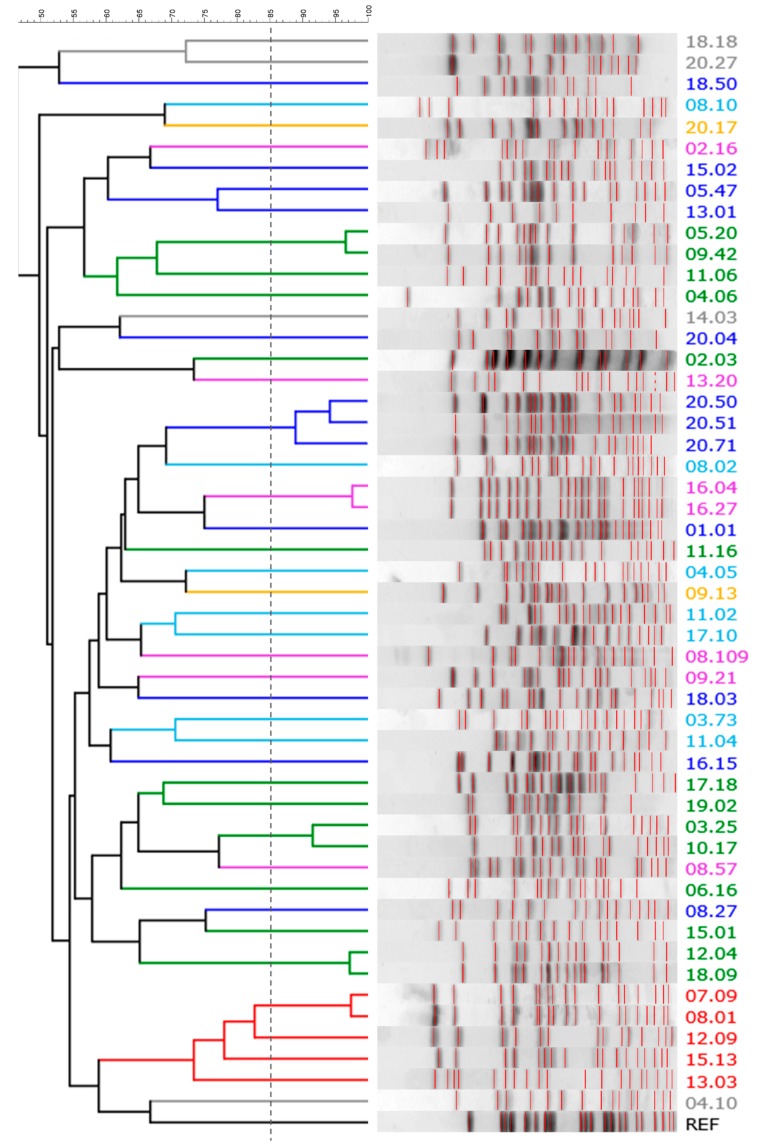
Figure 2.
The XbaI-PFGE pattern of E. coli strains: a UPGMA dendrogram derived from Dice’s coefficients, calculated based on their band profiles. Patterns with similarities >85% (dashed line) were ascribed to the same pulsotype. Strains are colored based on their phylogroup: A, cyan; B1, blue; B2, green; C, yellow; D, red; E, grey; F, pink.

