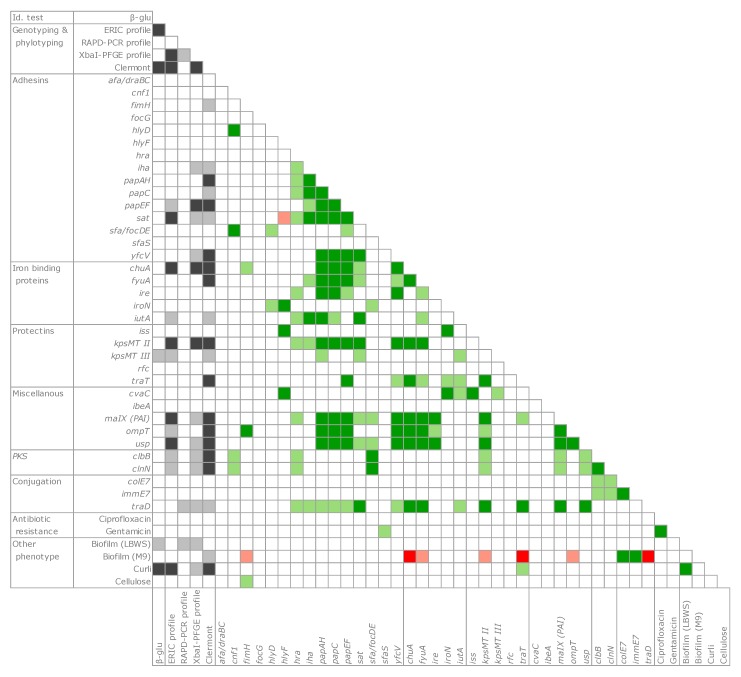
Figure 6.
Genetic determinants and phenotypic properties evaluated by Cramér’s V metrics. Association with genotype/phylotype clusters, grey; positive co-occurrence, green; negative co-occurrence, red. Dark and light shades indicate the levels of statistical significance (p < 0.01 and p < 0.05, respectively).

