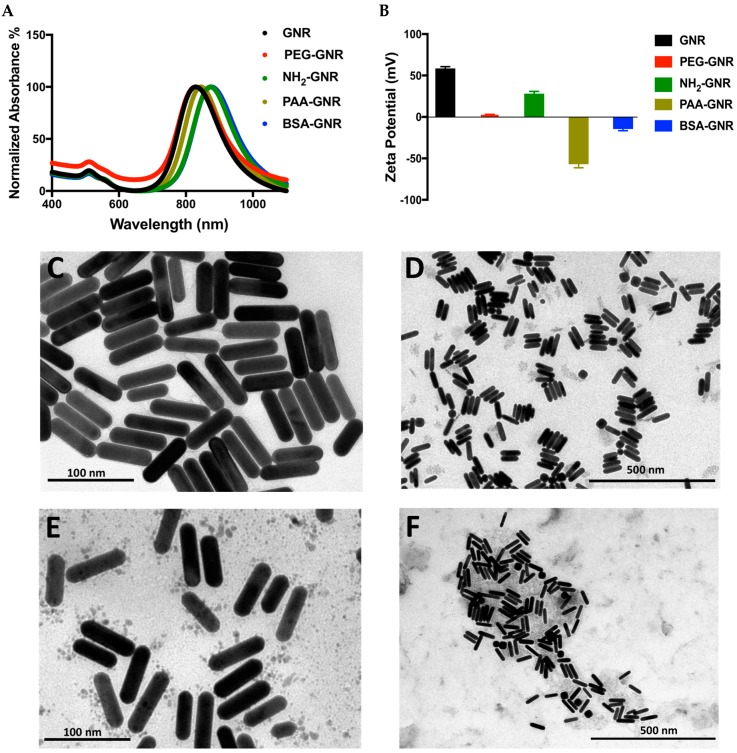
Figure 1.
(A) UV-vis absorption spectra of GNR, PEG-GNR, NH2-GNR, PAA-GNR and BSA-GNR indicate typical transverse and longitudinal peaks of the nanorods. (B) Zeta potential of GNR of different surface modifications; GNR, PEG-GNR, NH2-GNR, PAA-GNR and BSA-GNR. (C) TEM image of PEG-GNR. (D) TEM image of NH2-GNR. (E) TEM image of PAA-GNR. (F) TEM image of BSA-GNR.

