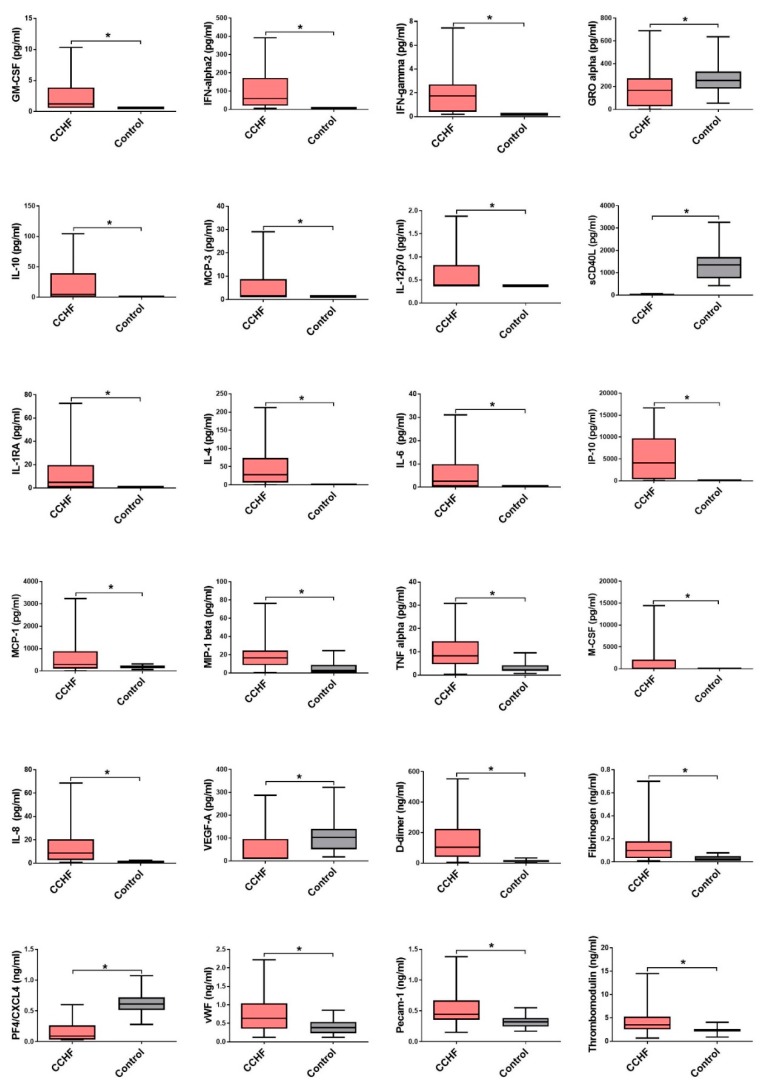
Figure 3.
The cytokine and chemokine concentrations with significant differences in CCHF patients (n = 70) in comparison to control group (n = 30). The samples were obtained median six days after the onset of symptoms. The statistically significant differences are marked with * (p < 0.05). ns= not statistically significant. The boxes represents medians with interquartile ranges; the whiskers depict minimum and maximum values (range). Identified outliers are not included in the figures above: GM-CSF (CCHF n = 5), IFN-α (CCHF n = 5), IFNγ (CCHF n = 1), GRO-α (CCHF, n = 6), IL-10 (CCHF n = 5), MCP-3 (CCHF n = 8), IL-4 (CCHF n = 8), IL-6 (CCHF n = 1), MCP-1 (CCHF n = 1), MIP-1β (CCHF n = 7), M-CSF (CCHF n = 1), VEGF-A (CCHF n = 6), TM (CCHF n = 5).

