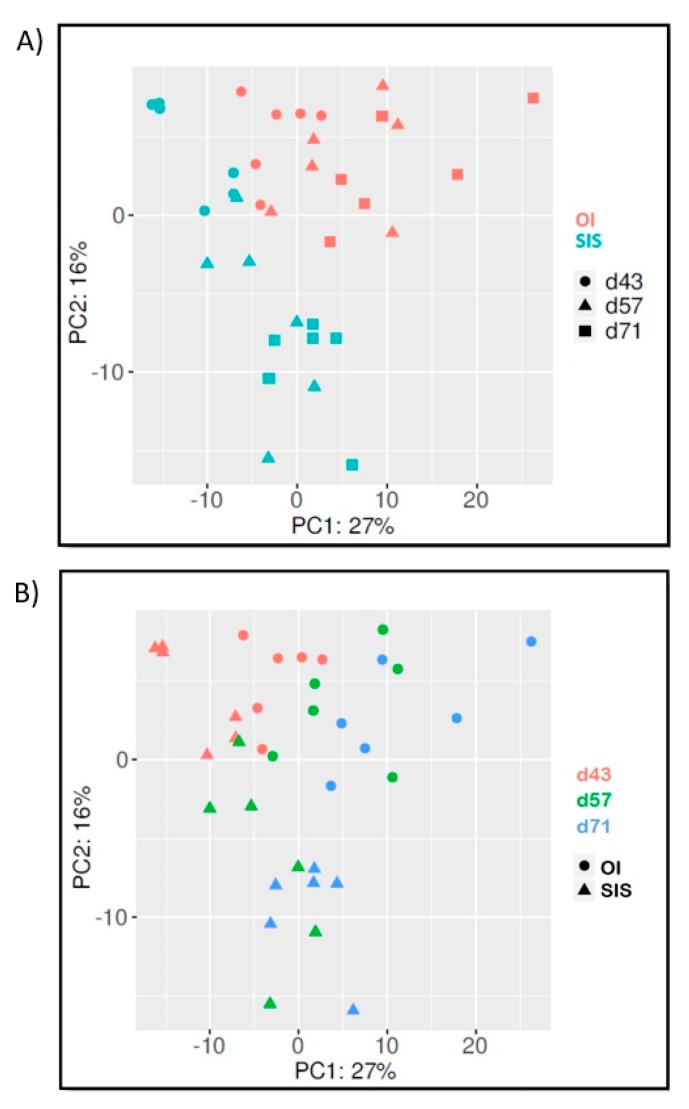
Figure 2.
Comparison of intestinal bacterial communities from whiteleg shrimp using principle coordinate analysis (PCoA). The x and y axes correspond to principal components 1 (PC1) and 2 (PC2), which explained the highest level of variation. Both panels show the same ordination graph, highlighting differences in profile either between genetic lines (A) or tenure in production tank (B).

