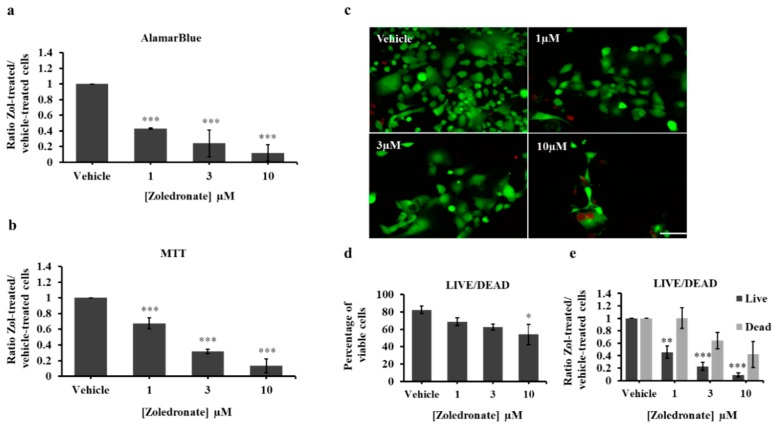
Figure 2.
AlamarBlue (a) and MTT (b) assays of HCC827 cells treated with vehicle (PBS1x) or Zol 1 µM, 3µM and 10 µM for 7 days in 1% serum conditions. The histograms in (a) and (b) represent the ratio of drug-treated cells divided by vehicle-treated cells (PBS1x) in three independent experiments. (c) representative photos of Live/Dead assay carried out on HCC827 following vehicle or Zol treatment at different concentrations. Live cells are in green and dead cells are in red. Scale bar 250 µm. (d) Percentage of viable cells [number of live cells/(number of live cells + number of dead cells) × 100]. (e) ratio of live cells or dead cells in vehicle or Zol-treated conditions. Significantly different from control * p < 0.05, ** p < 0.01 and *** p < 0.001.

