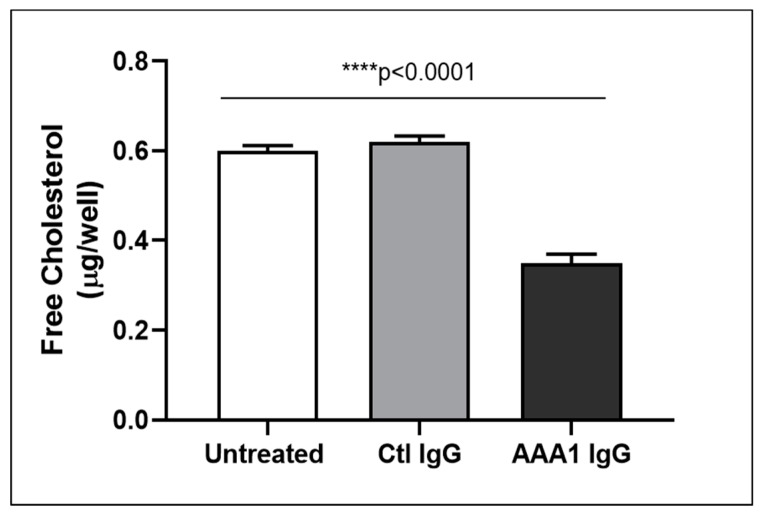
Figure 4.
Free cholesterol in the cell supernatant. Free cholesterol content in J774 supernatant after exposure of cells to serum, anti-apoA-1 IgGs or control IgGs was expressed as µg of free cholesterol per well. Data are expressed as the mean ± SD of the measurements done in triplicate and repeated three times (n = 3). Statistical differences were determined by one-way analysis of variance (one-way ANOVA), with p ≤ 0.05 being considered significant.

