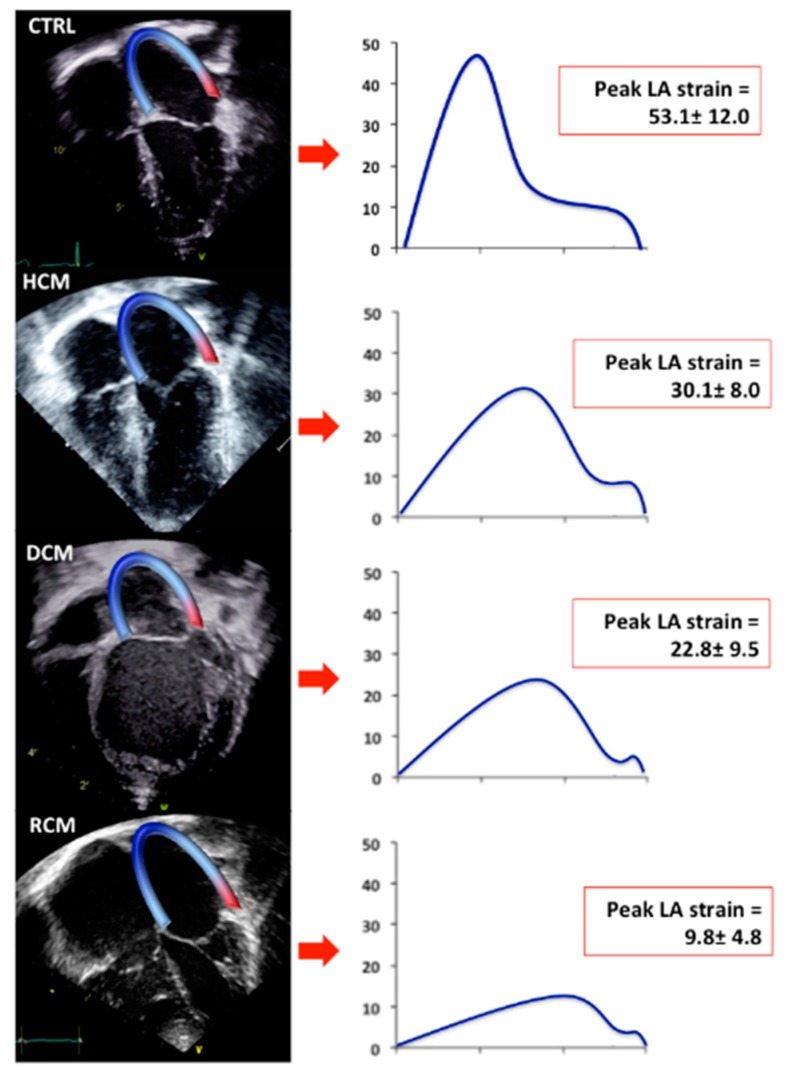
Figure 2.
Speckle Tracking Analysis of Left Atrial Strain in the study population. Apical 4-chamber views of CTRL, HCM, DCM and RCM with the endocardium of the LA traced (left). On the (right), LA strain curves are depicted as mean of each studied group (blue curves). CTRL: normal controls. HCM: Hypertrophic Cardiomyopathy. DCM: Dilated Cardiomyopathy. RCM: Restrictive Cardiomyopathy. LA: Left Atrial.

