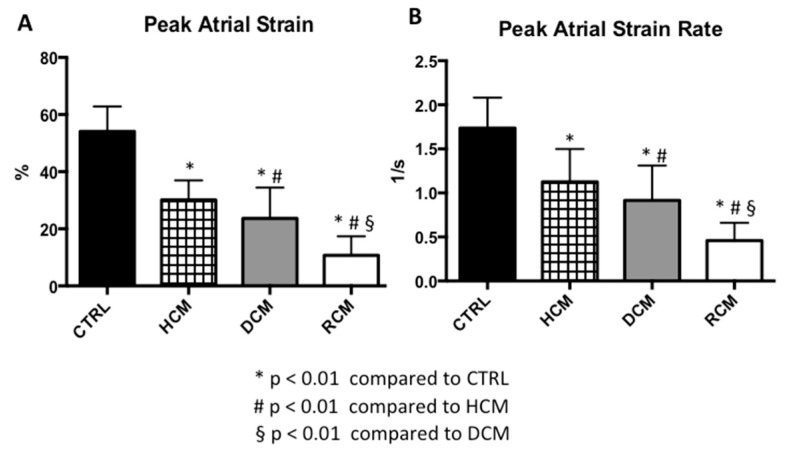
Figure 3.
Comparisons of left atrial strain and strain rate values among three groups of paediatric cardiomyopathies and healthy controls. Mean and standard deviation of peak left atrial strain (A) and strain rate (B) in the study population by cardiomyopathy type. * p < 0.01 compared to CTRL. # p < 0.01 compared to HCM. § = p < 0.01 compared to DCM. CTRL: normal controls. HCM: Hypertrophic Cardiomyopathy. DCM: Dilated Cardiomyopathy. RCM: Restrictive Cardiomyopathy.

