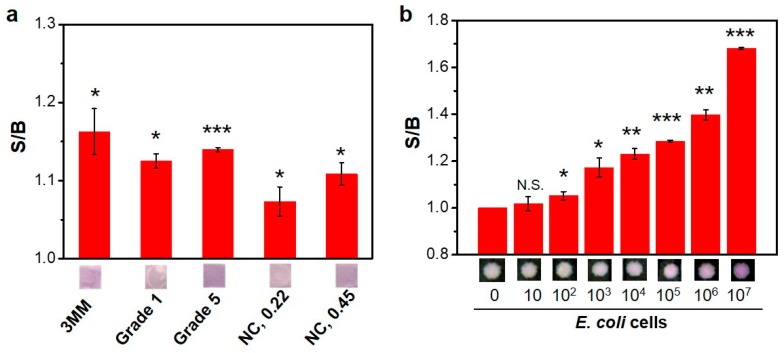
Figure 2.
(a) Characterization of the protein extraction capabilities of the different papers using BCA protein assay. (b) On-paper protein extraction from varying concentrations of E. coli. Each datum is the average of three measurements, and the error bar is the standard deviation. N.S., not significant; * p < 0.05, ** p < 0.01 and *** p < 0.001; obtained using unpaired t-test.

