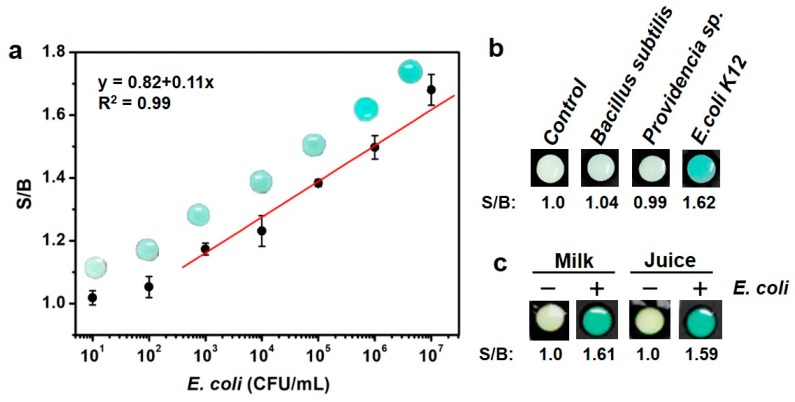
Figure 4.
(a) Plot demonstrating linear correlation between Signal-to-background (S/B) ratio and concentration of E. coli over the range of 103–107 CFU·mL−1. Each datum is the average of three measurements, and the error bar is the standard deviation. (b) Specificity of the device. (c) Detection of E. coli in the presence of complex sample matrices represented by orange juice and milk. Control: sample with pure reaction buffer. “+”: 107 E. coli cells added to a test sample. “−”: a test sample without E. coli cells. Photographs were taken after a signal-producing time of 1 min.

