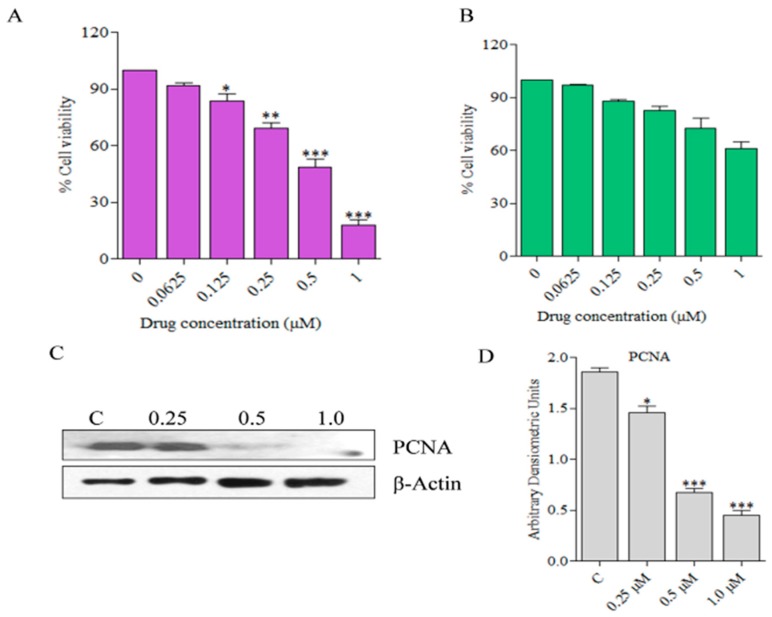
Figure 3.
Effects of C278 on the viability of SCC13 and HaCaT cells (A) SCC13 cells were treated with increasing concentrations of C278 at 24 h, and the percentage cell viability was estimated. Results are combined from two independent experiments and are presented as mean ± SD; n = 4. (B) HaCaT cells were treated with increasing concentrations of C278 at 24 h, and the percentage cell viability was estimated. Results are combined from two independent experiments and are presented as mean ± SD; n = 4. (C) Expression of PCNA was measured through western blot. The expression of this protein was normalized using β-Actin as a loading control. Figures are representatives of 2 independent experiments. (D) Densiometric analysis of bands was performed and the bar graphs expressing arbitrary units are presented. Error bar represents mean ± SD, n = 4. * p < 0.01, ** p < 0.001, *** p < 0.0001.

