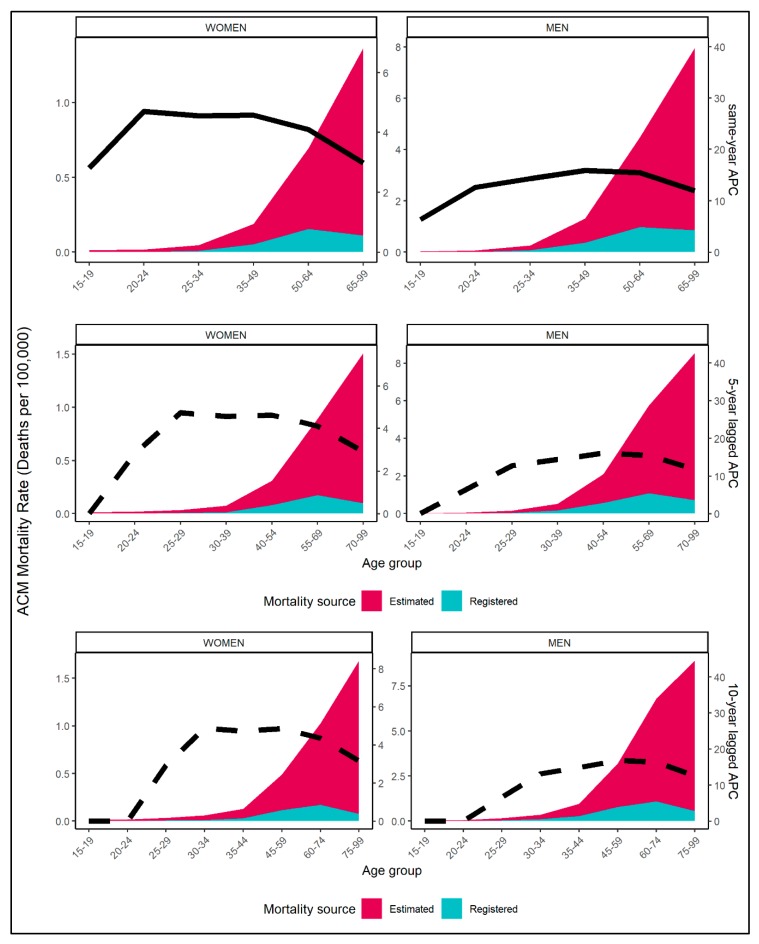
Figure 2.
Estimated (red) and registered (blue) ACM mortality rates per 100,000 and alcohol per capita consumption (APC) over selected age groups and by sex (column) for most recent available data of n = 77 countries; solid line denotes same-year APC (first row) and dashed line denotes 5-year (second row) and 10-year lagged APC (third row).

