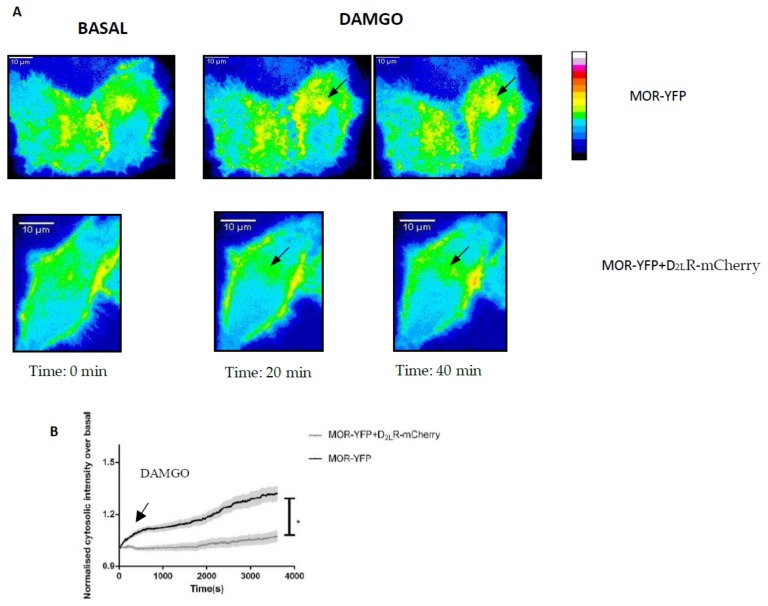
Figure 7.
Analysis of internalization of MOR upon stimulation with DAMGO in the presence or absence of D2LR by fluorescence live cell imaging. (A) HeLa cells transfected with pMOR-YFP with or without pD2LR-mCherry were used for fluorescence imaging as described in the materials and methods section. The images were captured for 1 h, with 10 s between successive images. At the 10th frame (100 s), DAMGO (7 µM) was injected using a syringe pump. (B) The plot depicts cytosolic fluorescence intensity normalized to the intensity before stimulation as a function of time. Approximately 50–60 cells were analyzed for each system. The results were expressed as mean ± standard error of mean (SEM) (* p < 0.05).

