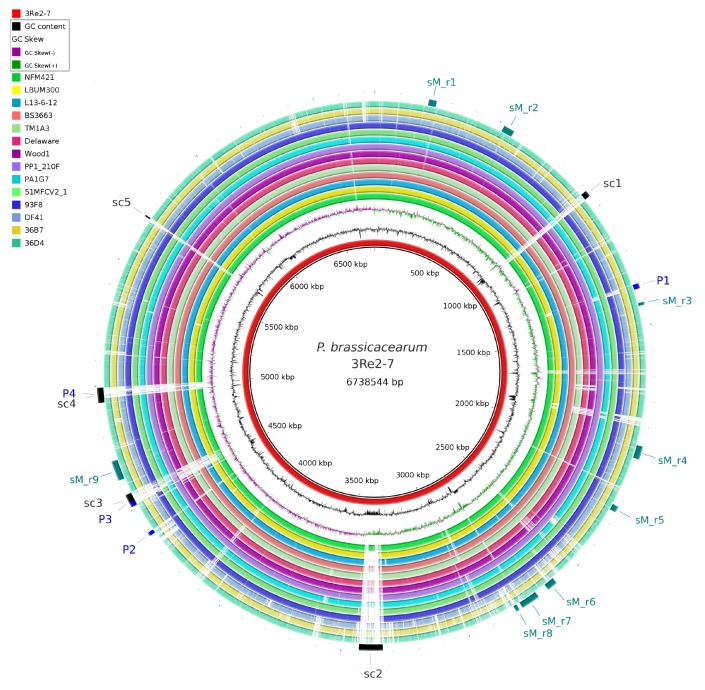
Figure 2.
BLAST comparison of P. brassicacearum genomes. Circular representation of the similarity between P. brassicacearum genomes listed in Table 1 with strain 3Re2-7 as reference (black innermost ring). The innermost graphs depict GC content (black) and GC skew (purple/green) followed by concentric rings of query sequences colored according to BLAST identity; gaps in the rings represent regions of low or no similarity. On the outermost ring, clusters of 3Re2-7 specific genes are indicated in black, abbreviated with sc* (Singleton cluster 1-5), gene regions related to biosynthesis of secondary metabolites detected with antiSMASH are indicated in teal and abbreviated with sM_r* (secondaryMetabolism_region 1-9) and detected phage sequences in blue (P1-P4). BLAST analysis and generation of this comparative view was done using BRIG [31].

