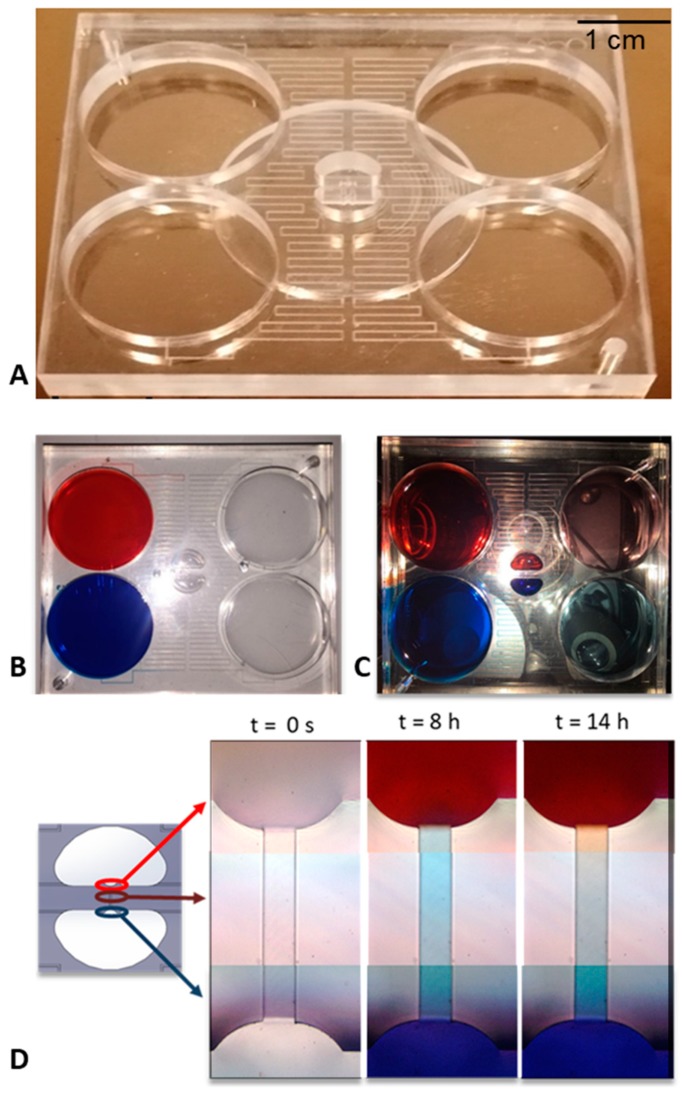
Figure 3.
Isometric view of the microfluidic device (A); the device in the loading phase of the dyes appears as in the figure (B), while at the end of the experiment there is a fairly uniform concentration within the central reservoirs and in the drain ones, maintaining, however, two flows at different separate concentrations (C). We also report the time-lapse acquisitions of the channel at the most significant time instants (D).

