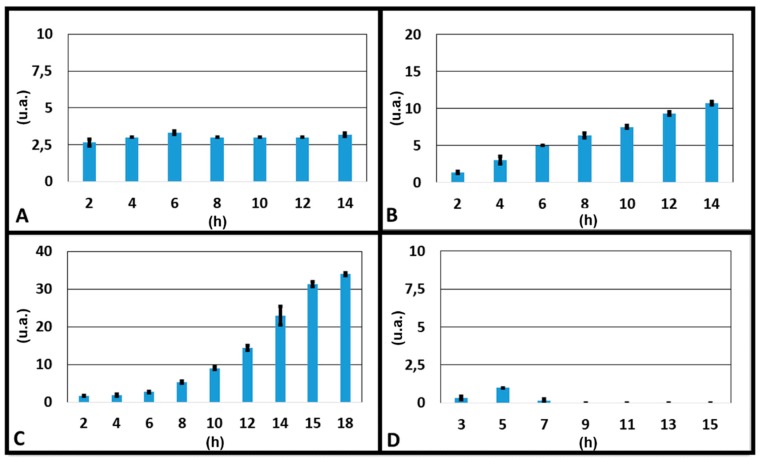
Figure 5.
Graphs of the gradients as a function of time obtained during the experiments with dyes in which: (A) 3000 µL of water + dye and 3500 µL of only water were loaded respectively in the two source reservoirs; (B) 3500 µL of water + dye and 3500 µL of only water were loaded respectively in the two source reservoirs; (C) 3750 µL of water + dye and 3500 µL of only water were loaded respectively in the two source reservoirs; (D) 3961 µL of water + dye and 3500 µL of only water were loaded respectively in the two source reservoirs.

