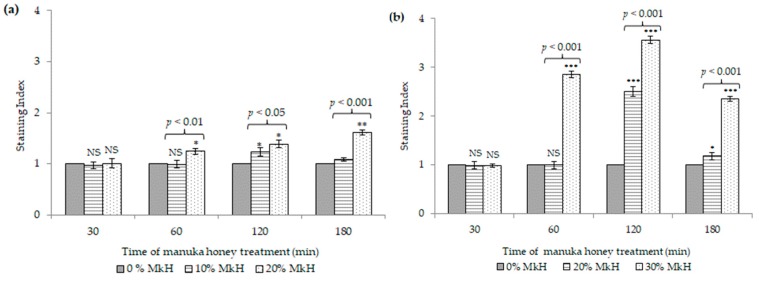
Figure 2.
Effect of MkH over membrane potential of S. aureus CECT 86 (a) and E. coli CECT 515 (b), evaluated using DiBAC4 (3) staining. Data at each time point corresponds to mean ± standard deviation. NS indicate no significant differences and asterisks indicate significant differences (*: p < 0.05; **: p < 0.01; ***: p < 0.001) between treated cells vs. the control (non-treated cells). p-values, indicate significant differences (p < 0.05) between the two honey concentrations tested.

