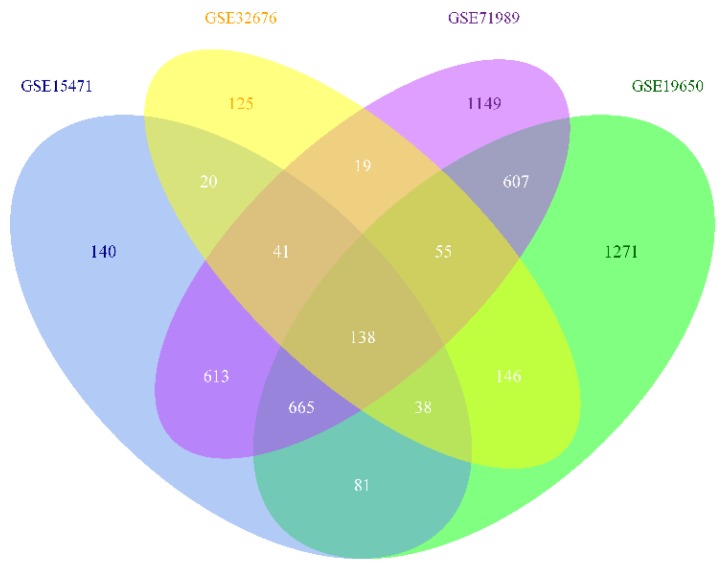
Figure 1.
Four-set Venn diagram showing the common differentially expressed genes from the four Gene Expression Omnibus series datasets. Differentially expressed genes (DEG) were identified with classical t test, statistically significant DEG were defined with p < 0.01 and log2-fold change (log2FC) >1 or < −1 as the cut-off criterion for every dataset.

