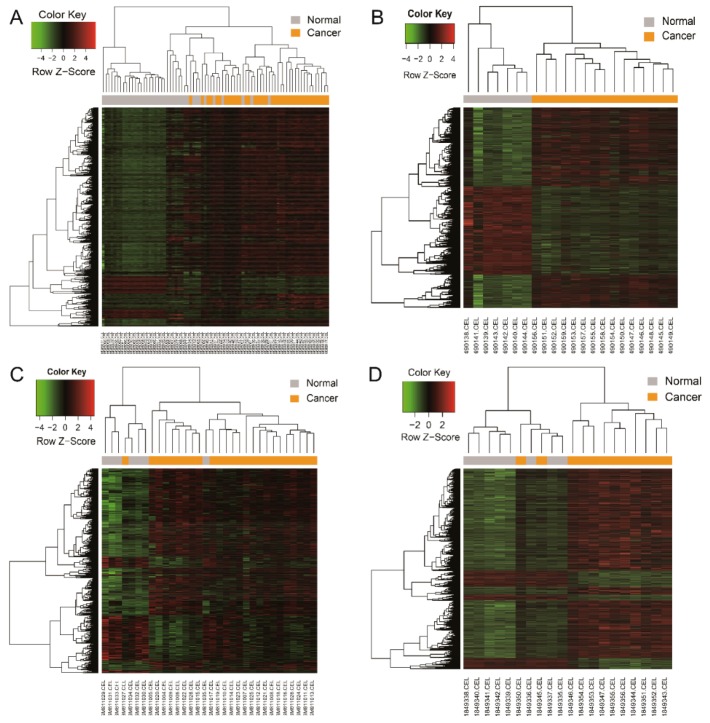
Figure 2.
Heat map showing up-regulated and down-regulated differentially expressed genes in pancreatic adenocarcinoma compared to the normal samples in the four datasets. The expression values are log2 transformed for absolute value of fold changes (>1 or <−1) between normal tissues and pancreatic adenocarcinoma samples. Green represents down-regulation and red represents up-regulation. (A) GSE15471; (B) GSE19650; (C) GSE32676; (D) GSE71989.

