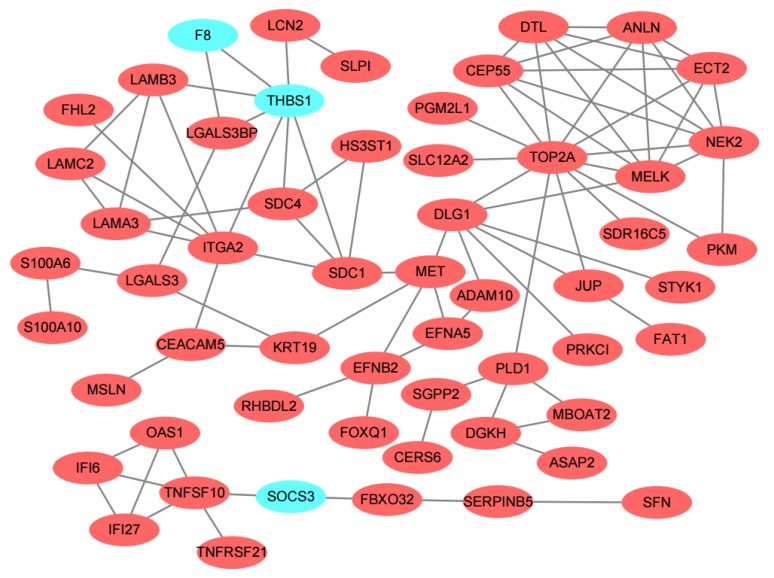
Figure 3.
Differentially expressed genes protein–protein interaction (PPI) network was constructed and visualized using Cytoscape software. Red nodes represent up-regulated genes and baby blue nodes represent down-regulated genes in pancreatic adenocarcinoma compared to the normal samples. Only two nodes included one edge and alone node were removed from the network.

