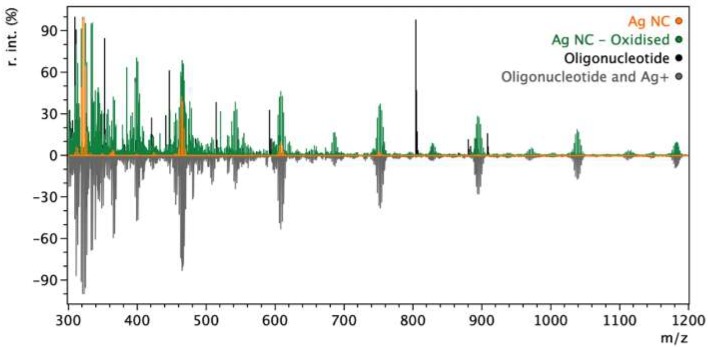
Figure 2.
MALDI-MS of the oligonucleotide (black), oligonucleotide with AgNO3 (grey, “Oligonucleotide and Ag+”), Ag NC after reduction (orange) and the oxidized Ag NC (green, “Ag NC—Oxidised). The spectrum of oligonucleotide and is shown inverted for easier comparison with the other data. Individual spectra and peaks are shown in Figures S4–S7, and Table S1.

