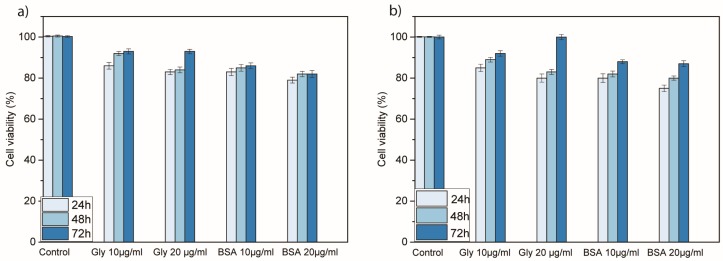
Figure 4.
Cellular viability of (a) NIH 3T3 and (b) MCF7 cells treated with different concentrations (10 and 20 µg mL−1) of glycopeptide 1 and BSA-FITC for 24, 48, and 72 h, revealed by WST 1 assay. Viability (%) is evaluated for the samples of peptides against a nontreated control (ctrl). Data are expressed as mean ± standard error as calculated from three separate experiments.

