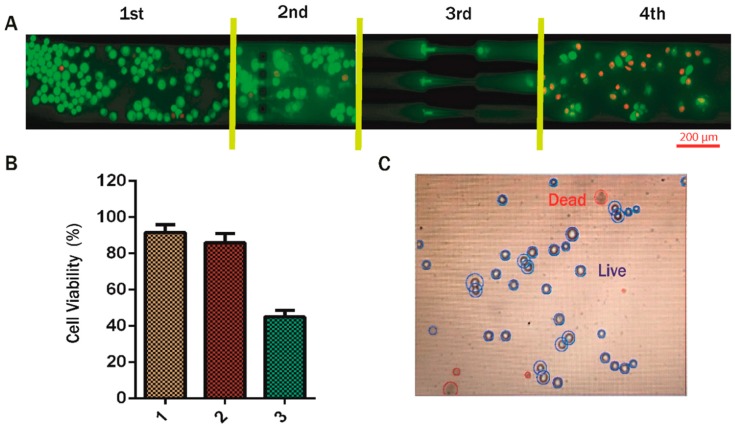
Figure 7.
Cell viability assessment. (A) Acridine orange and ethidium bromide (AO/EtBr)-stained images at different sections of the channel; (B) comparison of the percentage of EMT cells viable after passing through the constriction with the initial conditions and with cells maintained in the same environment for the same period of time but not passed through the constriction. Cell condition 1 refers to the initial EMT cells, cell condition 2 refers to mock experimental control EMT cells kept in the same environment without passing through the channel, and cell condition 3 refers to the cells collected from the outlet of the microchannel; (C) image of stained cells obtained from the Countess automated cell counter.

