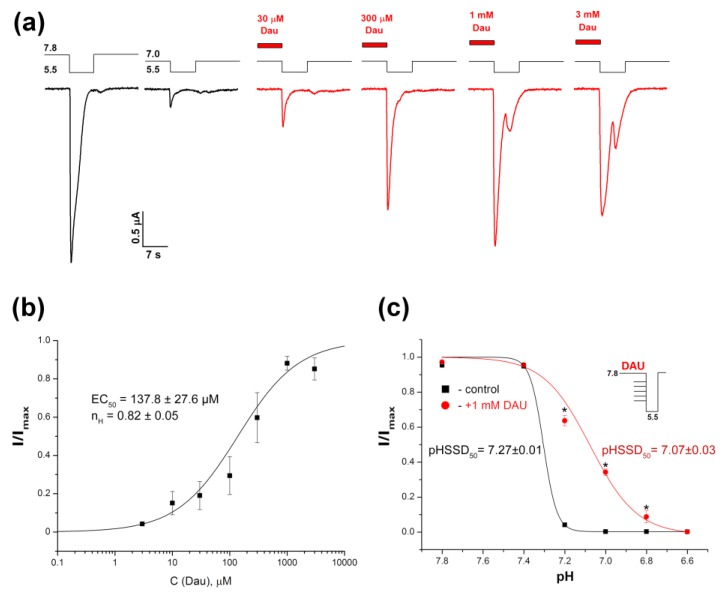
Figure 4.
DAU-induced inhibition of steady-state desensitization (SSD) of rat ASIC1a. (a) Whole-cell currents obtained from the channels held at the conditioning pHs of 7.8 and 7.0 in response to a pH-5.5 stimulus, with (red) or without (black) a pre-incubation for 15 s with DAU at various concentrations. (b) The dose–response curve fitted to the logistic equation for peak ASIC1a amplitudes at various concentrations of pre-incubated DAU. I/Imax is the main peak’s amplitude at a conditioning pH of 7.0, normalized to the maximum amplitude (Imax), which we calculated for each oocyte via individual fitting. Data are presented as mean ± SEM (n = 6). (c) pH dependence of the channel’s SSD without (black curve) and with (red curve) pre-incubation of 1 mM DAU. ASIC1a held at various conditioning pHs was activated by same pH 5.5 stimulus. The peak current amplitudes are plotted as a function of pH and fitted to the logistic equation. Data are presented as mean ± SEM (n = 5); * P < 0.05.

