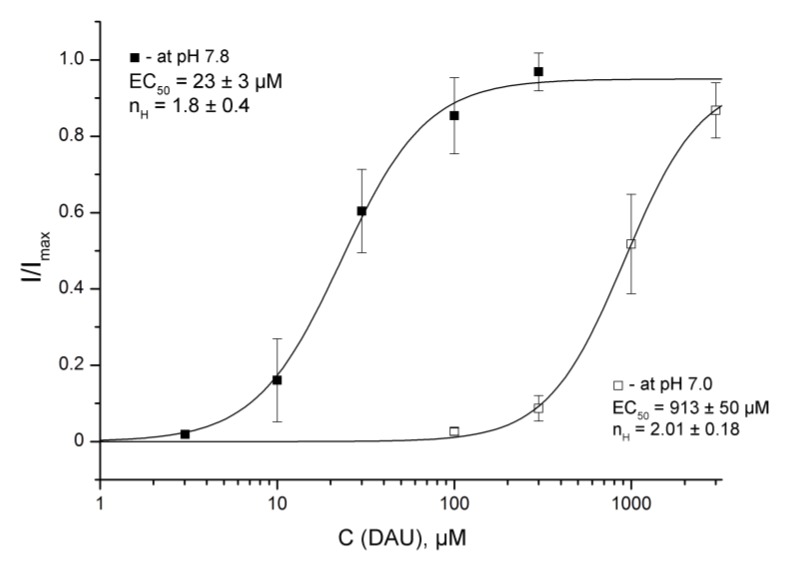
Figure 5.
DAU-induced development of the second peak at conditioning pHs of 7.8 and 7.0. Dose–response curves for the second peak by DAU pre-incubation at the holding pHs of 7.8 and 7.0 were plotted for same pH 5.5 activating stimulus. I/Imax is the second peak’s amplitude at a conditioning pH of 7.8 or 7.0, normalized to the maximum amplitude (Imax), which we calculated for each oocyte via individual fitting. Data are presented as mean ± SEM (n = 6).

