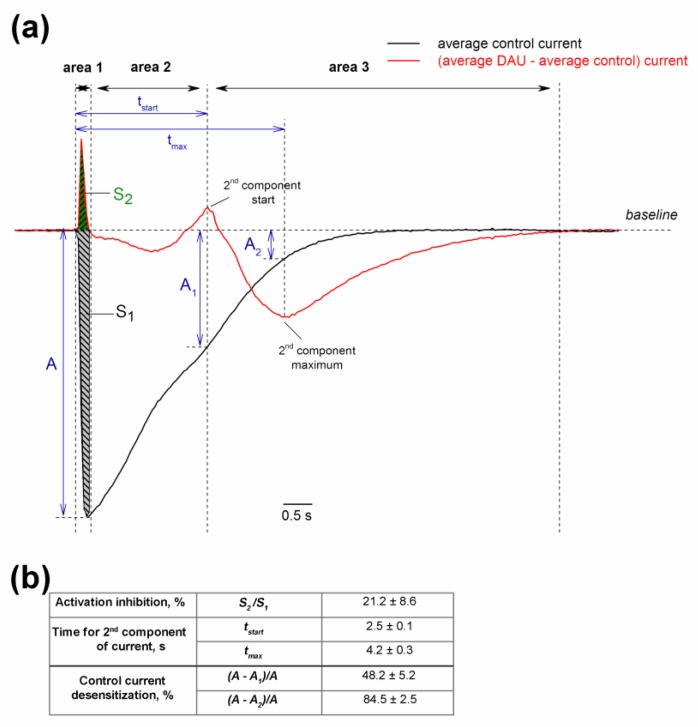
Figure 8.
Dual effect of pre-incubated DAU on ASIC1a channel. (a) Average control current (n = 7; black trace) and current obtained by subtracting the average control current from the average current induced by 300 µM DAU (n = 7; red trace). The black arrows indicate the boundary of the three conditional zones of the DAU action: Area 1 (inhibitory), area 2 (neutral), and area 3 (potentiating). For area 1, we calculated the integral control current S1 (grey) and the integral inhibited current S2 (green). A is the maximal amplitude of the control current; A1 and A2 are the amplitudes of the control current at time tstart (the start of second peak’s development) and tmax (the second peak’s maximum), respectively. (b) Calculated parameters of the DAU effect, presented as mean ± SEM (n = 7). The inhibition of the channel activation as a ratio of area S2 to area S1 is expressed as a delay in the of channel’s opening kinetics without a change in the peak amplitude (A). We estimated the percentage by which the main current is desensitized at tstart and tmax using the ratio of the difference between amplitudes (A minus A1 and A2, respectively) to amplitude A.

