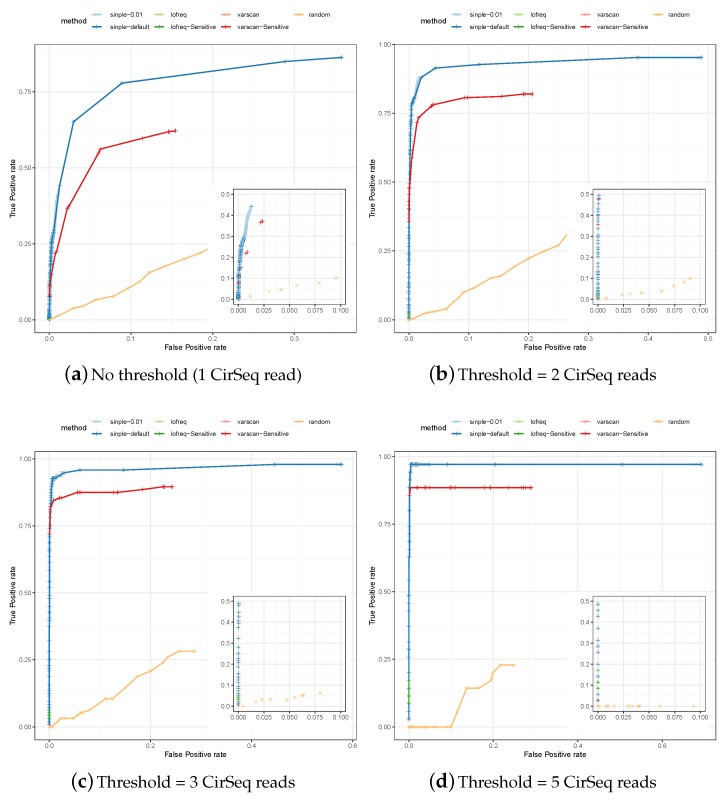
Figure 3.
The Receiver-Operator Curves (ROCs) for the specificity and the sensitivity of variants predicted by SiNPle, LoFreq, VarScan2 (both standard and sensitive mode), and a control method based on the random selection of variable positions on the genome irrespective of whether they are true variants or not (see Section 2), from an input of 100,000 reads randomly extracted from a poliovirus dataset sequenced with CirSeq [19]. CirSeq allows the experimental discovery and validation of very low-frequency variants present at population level. The figures were obtained by setting different thresholds on the lists of true and false positives identified by calling consensus on CirSeq reads (see Section 2). All the three methods were run in both a default and a sensitive mode (see Section 2 for their definitions).

