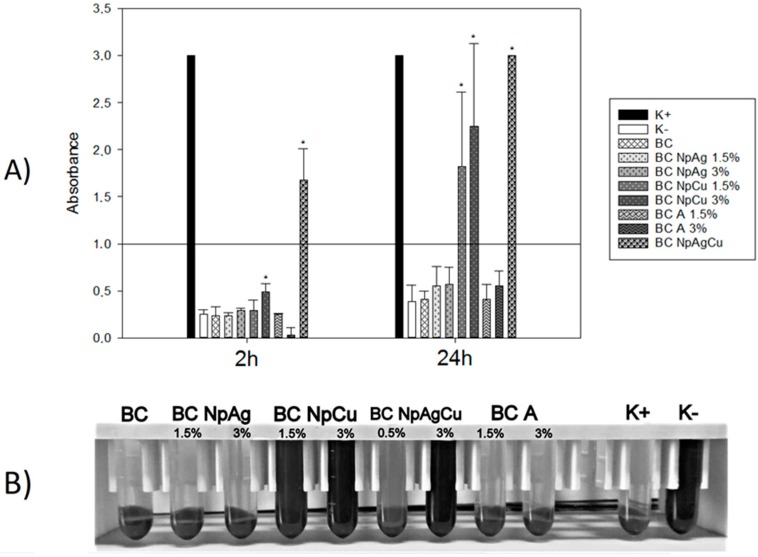
Figure 3.
Erythrocyte hemolysis after in vitro exposure to unmodified and modified cement specimens: (A) Hemolysis at 2 h and 24 h incubation of materials with erythrocytes—the line indicates the threshold value above which the hemolysis take place (n = 5; data are the means ± SD; * significantly different from negative control—p < 0.05); (B) Hemolysis after 24 h incubation of specimens with erythrocytes (the presented pictures are representative for 5 experiments).

