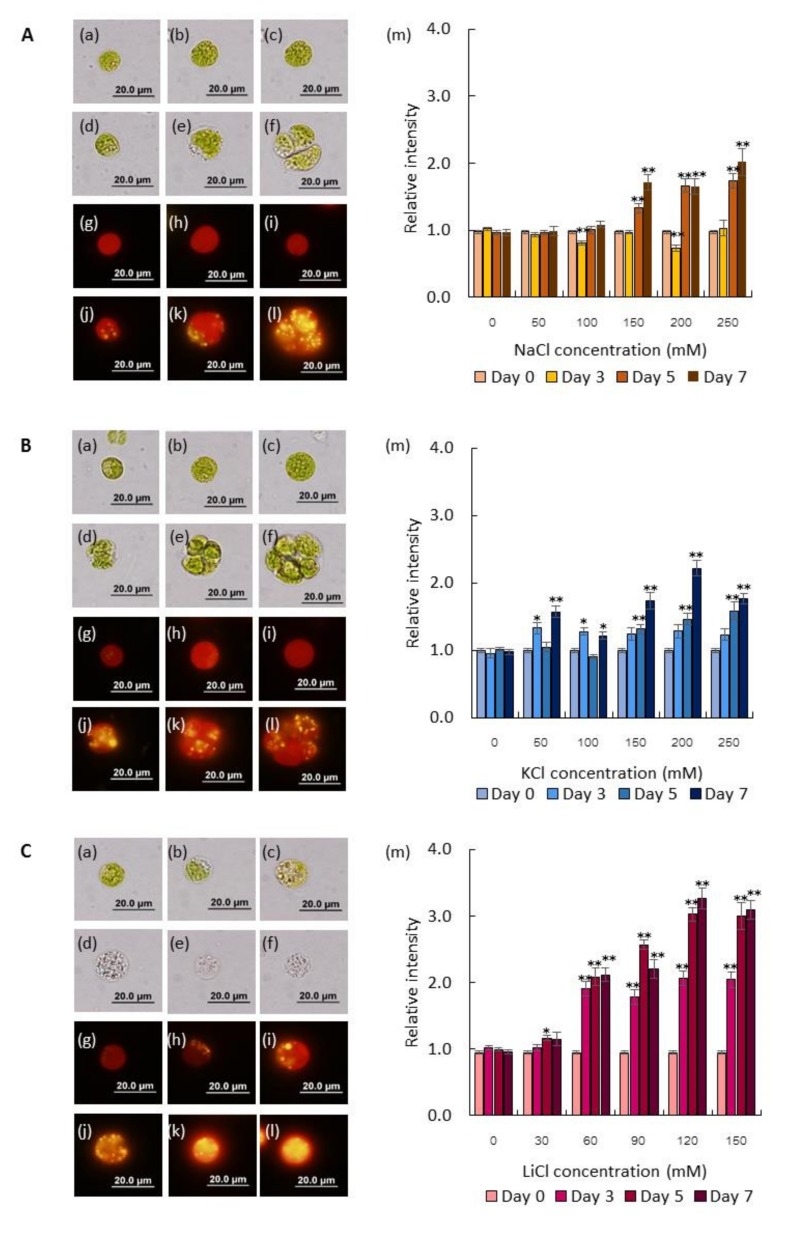
Figure 1.
Effects of salt stress on morphology and lipid accumulation. (A) NaCl stress. (B) KCl stress. (C) LiCl stress. C. reinhardtii (137c) cells observed under a light microscope (a-f) and fluorescent microscope (g-l). Cells at the exponential growth phase were subjected to salt stress (NaCl or KCl) at various concentrations, including 0 mM (a, g), 50 mM (b, h), 100 mM (c, i), 150 mM (d, j), 200 mM (e, k), and 250 mM (f, l) for 7 days. In the case of LiCl, the concentrations were 0 mM (a, g), 30 mM (b, h), 60 mM (c, i), 90 mM (d, j), 120 mM (e, k), and 150 mM (f, l) for 7 days. Morphology and lipid droplets were observed by Nile red staining, as described in Materials and Methods. Relative intensity of lipid content under NaCl stress was analyzed using ImageJ software (M). Data are expressed as mean ± SE. * p < 0.01, ** p < 0.001, unpaired T-test (n ≥ 10).

