Figure 6.
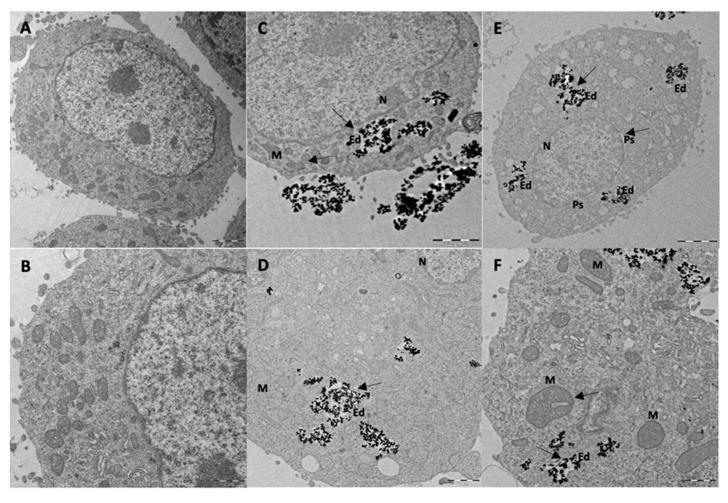
Internalization of BMNPs and Ff35-BMNPs. Ultrastructural alterations produced by Ff35-BMNPs. (A,B): Control HepG2 cells. (C,D): HepG2 cell exposed to BMNPs has ultrastructure similar to control cells. (E,F): Treatment with Ff35-BMNPs (concentration of BMNPs was 300 µg mL−1 and Ff35 was 1 μM). Perinuclear space (Ps) is visible. The two nuclear membranes were separated showing a dilatation of the Ps. It is notably mitochondrial (M) rarefaction, disorganization, and dilatation. Both BMNPs and Ff35-BMNPs were internalized by HepG2 cells via endocytosis and compartmentalized in endosomes (Ed). Scale bar corresponds to 2 µm (A,C,E) and 1 µm (B,D,F).

