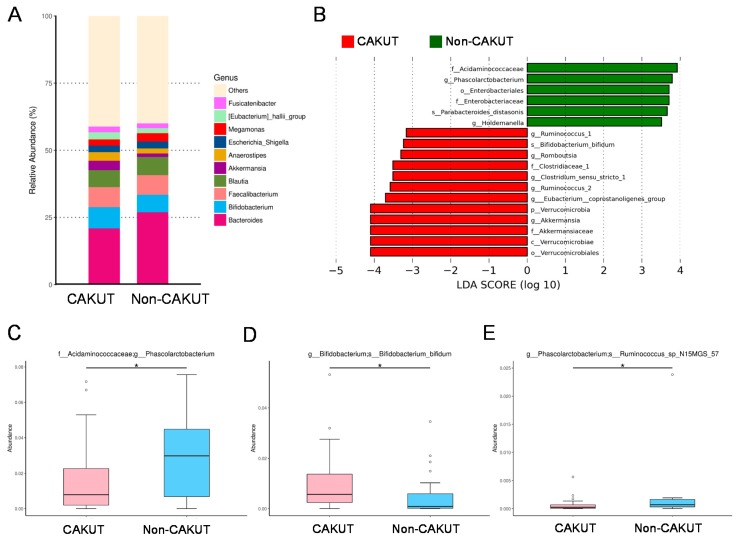
Figure 2.
(A) Relative abundance of the top 10 genera of the gut microbiota between the CAKUT and non-CAKUT group. (B) Linear discriminant analysis effect size (LEfSe) to identify the taxa that were significantly different between the CAKUT and non-CAKUT group. The threshold of the linear discriminant was set to 3. (C) The abundance of genus Phascolarctobacterium, (D) species Bifidobacterium bifidum, and (E) species Ruminococcus_sp_N15MGS_57 in CKD children with CAKUT vs. non-CAKUT. The asterisk indicates p < 0.05.

