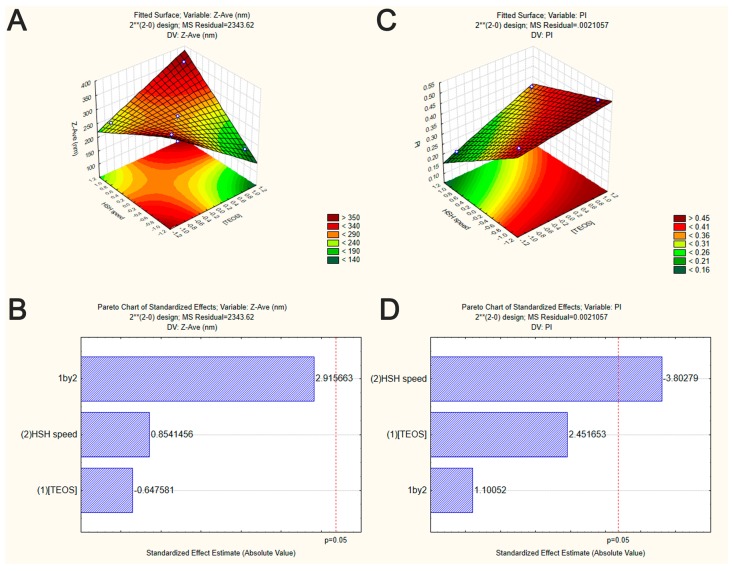
Figure 1.
Graphical representation of the interaction between the independent variables on SiNP properties (factorial design experiment set in Table 1). Surface response plots of the effect of TEOS concentration and HSH speed on Z-Ave (A) and PI (C) of SiNP. Pareto chart of the effect of TEOS concentration and HSH speed on Z-Ave (B) and PI (D) of SiNP. Vertical lines in Pareto chart indicate the critical effect at 95% confidence level.

