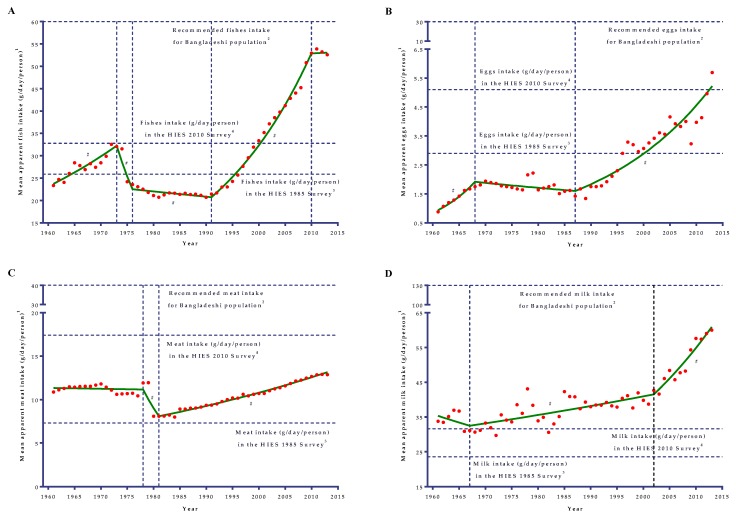
Figure 2.
Joinpoint analyses of the mean apparent intakes of fish (A), egg (B), meat (C), and milk (D) in the diets of the Bangladeshi population from 1961 to 2013. A vertical dotted line represents the joinpoints. 1Mean apparent intakes of fish (A), egg (B), meat (C), and milk (D) refer to the average availability of fish (A), egg (B), meat (C), and milk (D) in the diets for consumption. 2A horizontal dotted line represents the recommended fish (A), egg (B), meat (C), and milk (D) intake based on the desirable dietary pattern (DDP) for the Bangladeshi population [20]. 3A horizontal dotted line represents the mean per capita intakes (g/day) in the diet of the Bangladeshi population based on the HIES 1985 survey [7]. 4A horizontal dotted line represents the mean per capita intakes (g/day) in the diet of the Bangladeshi population based on the HIES 2010 survey [7]. # denotes the annual percent change (APC) that was significantly different from 0 (p < 0.05).

