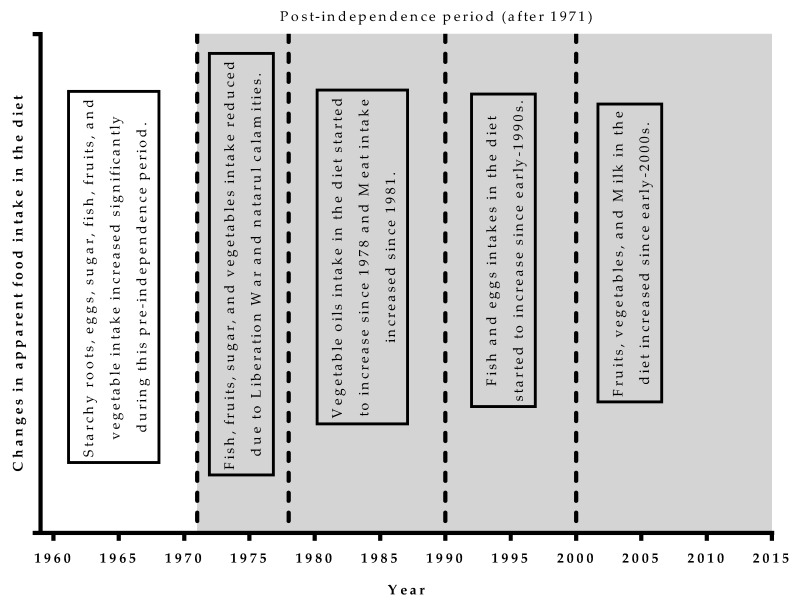
Figure 4.
A brief summary of the significant changes over the periods in the apparent dietary intake in Bangladesh from1961 to 2013. Shaded area indicates the time after independence and the unshaded area represents the time before independence. The vertical lines represent the year where significant changes started.

